Selecting any lap on the lap logs screen will move to the log analysis screen.
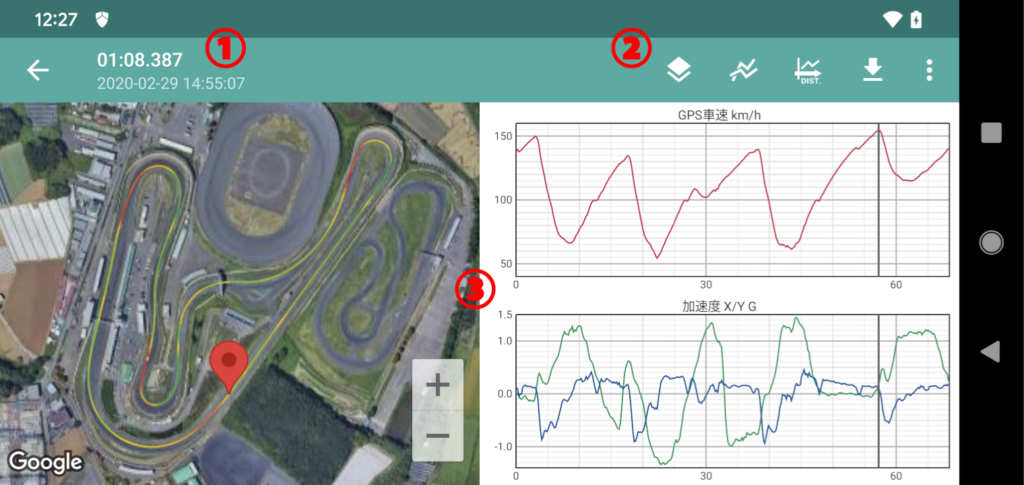
| (1) Log overview | Displays the name of the log and the date it was recorded. |
| (2) Menu | Displays menus related to logging. |
| (3) Log area | Displays logs in any format. |
Laps in a session can be switched to the previous or next lap by swiping left or right.
Menu
The menu for manipulating logs is displayed on the right side of the title bar of the log analysis screen.
The number of menus displayed will increase or decrease depending on the logs to be displayed and the status of the screen. Some functions are available for subscription.
*Menus that do not fit in the title bar can be selected from ![]() icon on the right.
icon on the right.
| previous lap | Displays the previous lap. (Displayed if a previous lap exists in the session) | |
| next lap | Displays the nextlap. (Displayed if a next lap exists in the session) | |
| log type | Select the type of graph/map to display the log for this lap. | |
| vehicle log type | Select the type of vehicle log. (Displayed when “Vehicle Log” is selected as the log type) *This function is available for subscription. | |
| compare | Select other laps to compare with this one. | |
| X-axis: dist | Set the horizontal axis of the graph to distance. (Displayed when the current horizontal axis is time) *This function is available for subscription. | |
| X-axis: time | Set the horizontal axis of the graph to time. (Displayed when the current horizontal axis is distance.) *This function is available for subscription. | |
| export | Export lap logs in CSV, NMEA or other formats. | |
| save as | Save a copy of the lap as an alias. Saved lap logs can be viewed from the “Saved Laps” screen. | |
| adjust line | Move to the Adjust driving line screen. (Displayed when the driving line is shown.) | |
| delete | Delete the lap. |
Log type
Select “Log Type” from the menu to select the log type to be displayed.
*If multiple log types are selected, the screen will be divided and displayed.
Speed graph
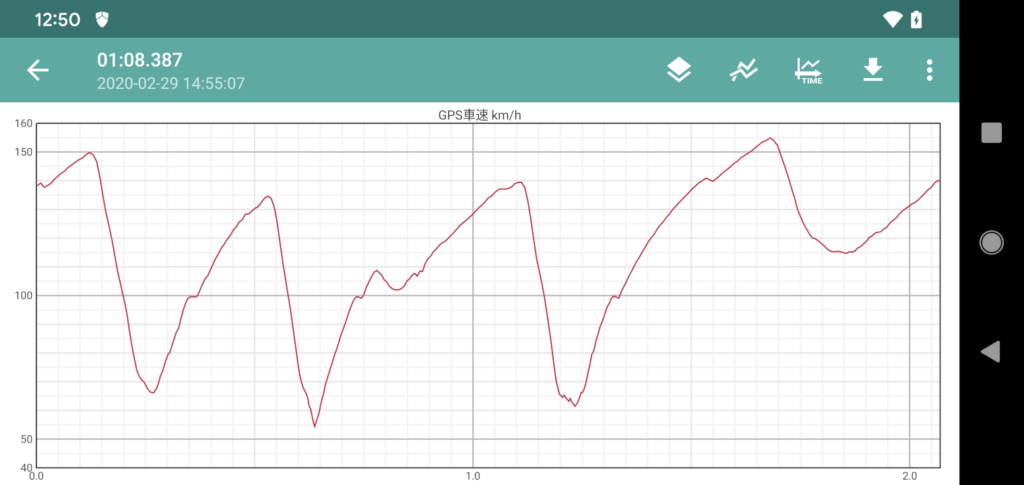
This graph displays the vehicle speed as measured by GPS.
Acceleration graph
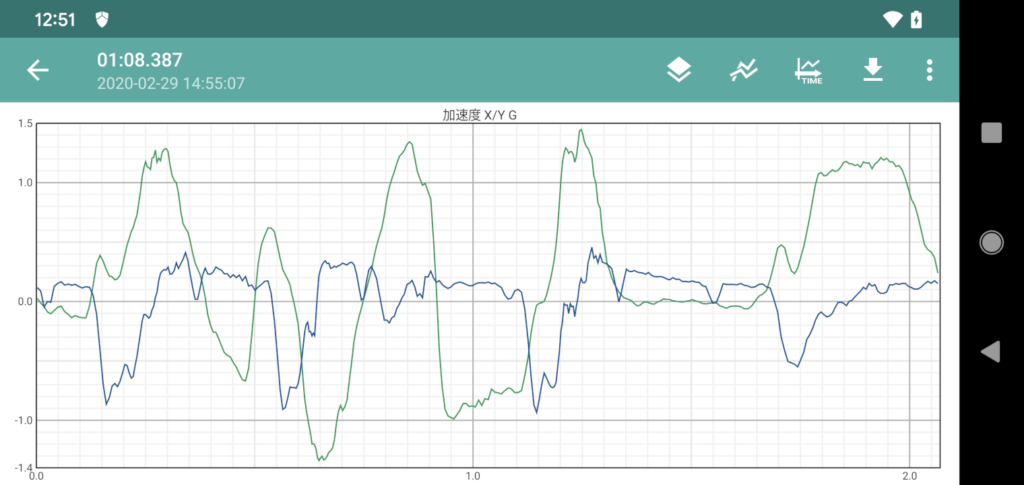
The graph shows acceleration in front/back (blue) and left/right (green).
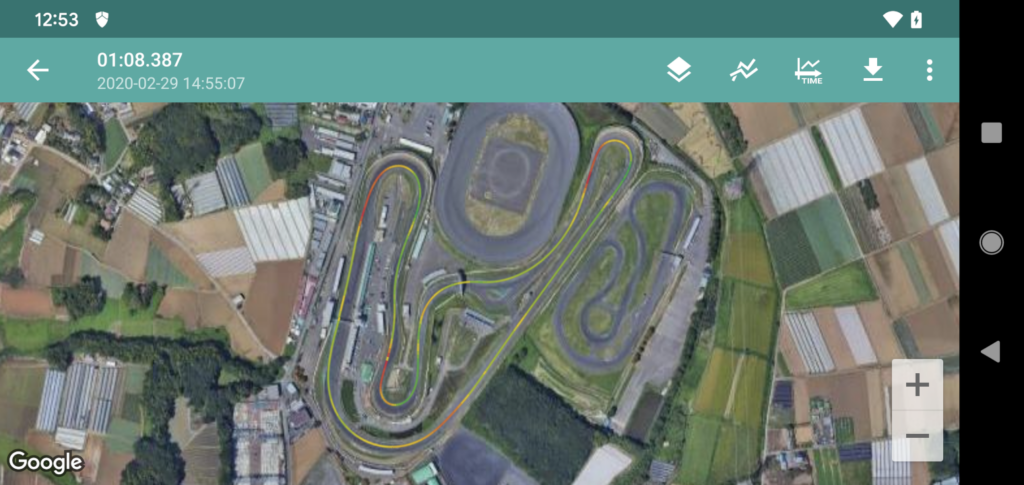
Driving line
Displays driving lines on the map.
The driving line is displayed in green for acceleration, red for deceleration, and yellow for neither acceleration nor deceleration.
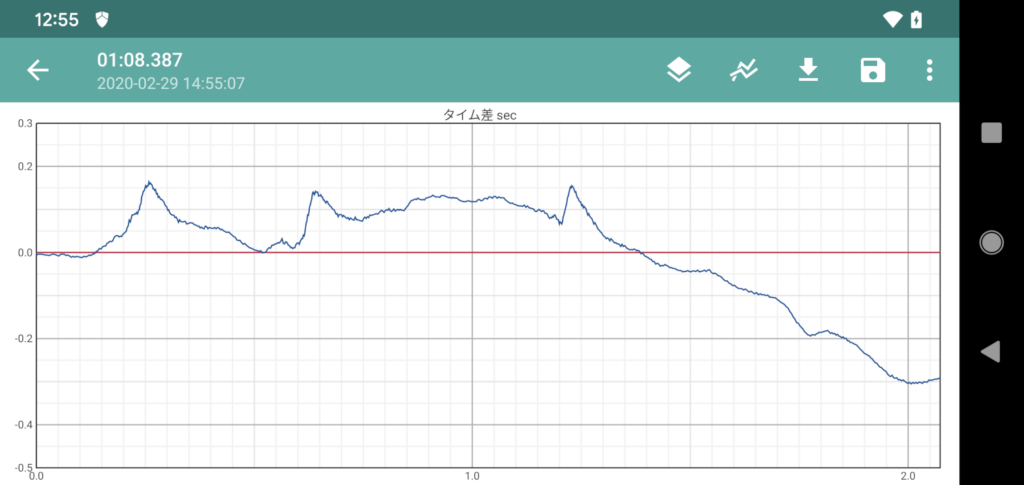
Time gap
This graph displays the time difference when comparing multiple laps.
*The graph can be displayed when laps to be compared are set and the horizontal axis of the graph is distance.
*This function is available for subscription.
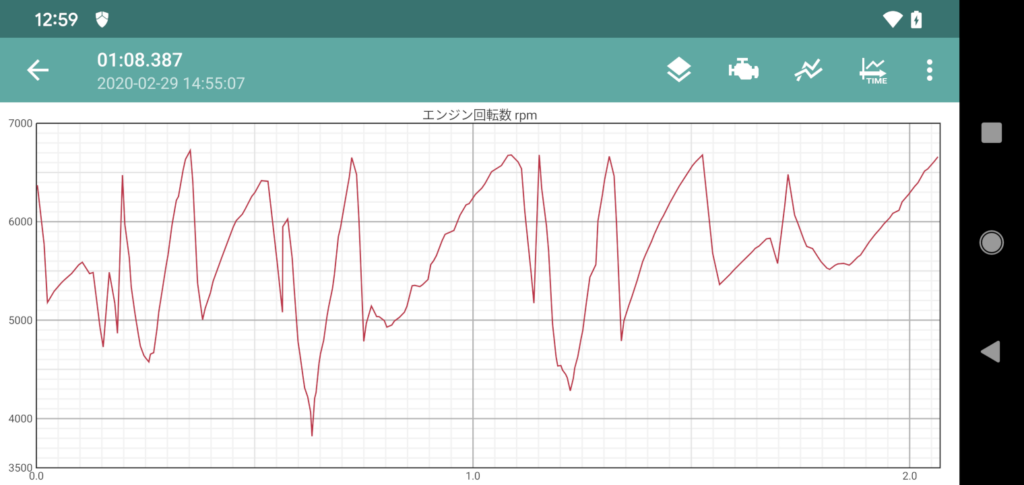
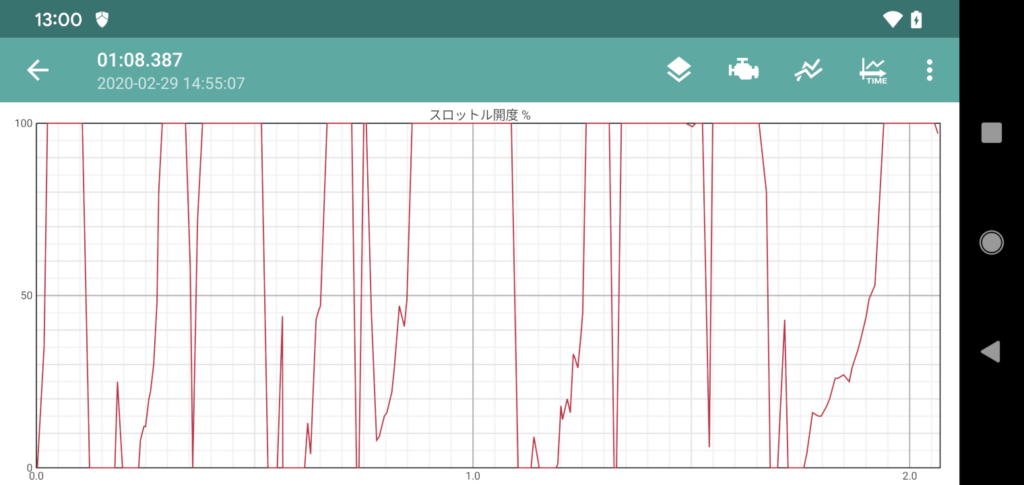
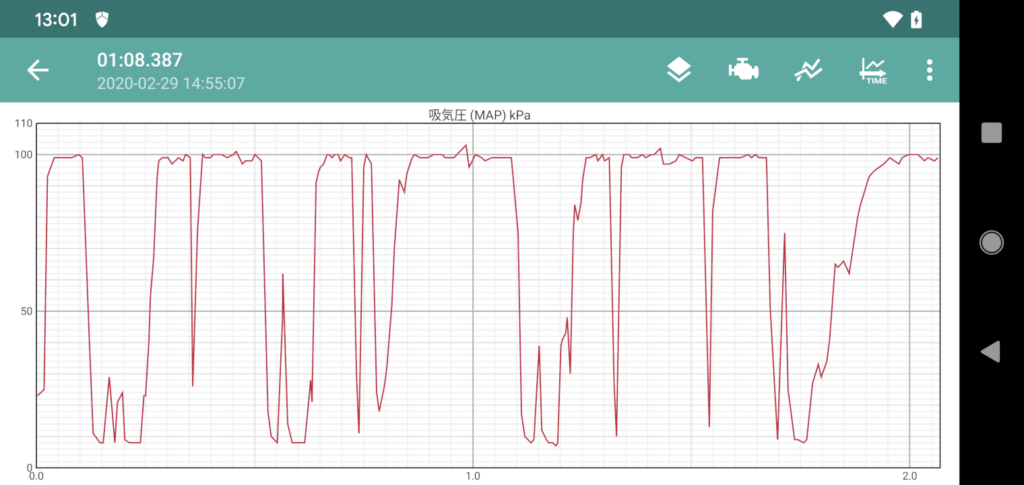
Vehicle log
This graph displays any information in the vehicle information log when the log contains vehicle information.
The information to be displayed can be selected from the “Vehicle Log Type” menu.
*The information that can be displayed varies depending on the car model and other factors.
*This function is available for subscription.
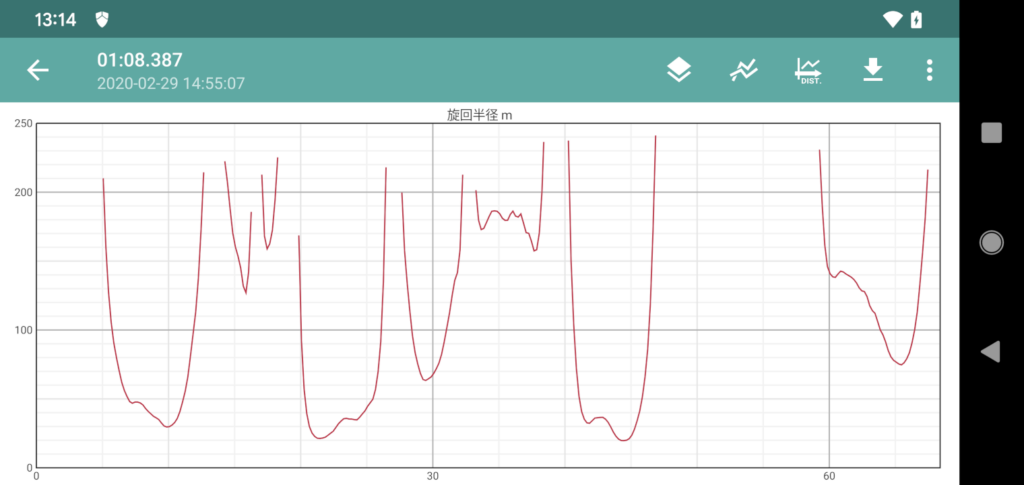
Turning radius
This graph displays the turning radius when driving.
*This function is available for subscription.
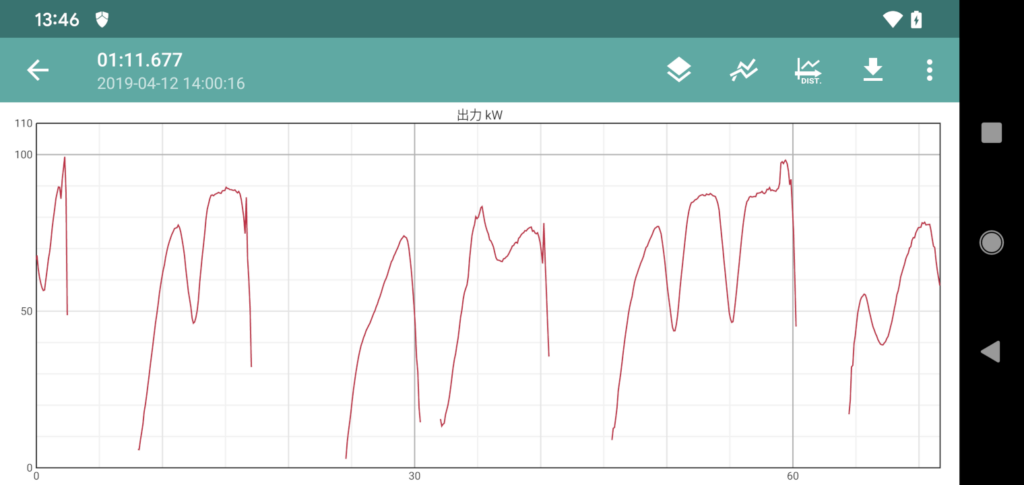
Power
This graph displays the power of the vehicle.
*Vehicle power is information calculated from changes in vehicle speed, not engine power. Information for calculating power (vehicle weight, etc.) can be set from Settings→Vehicle Information.
*This function is available for subscription.
Compare logs
Selecting the “Compare Log” menu allows you to compare the currently displayed lap with other laps.
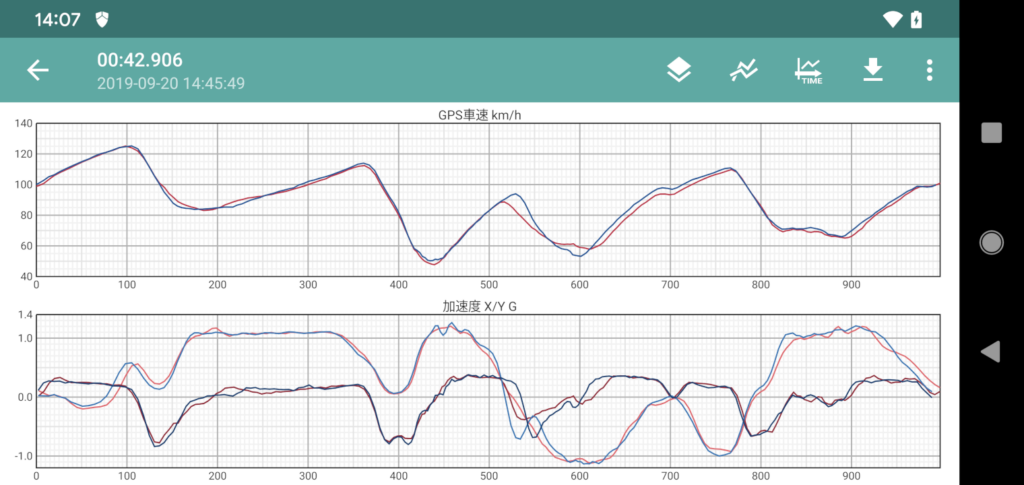
In Compare Logs, the current lap is displayed in red and other laps to be compared are displayed in blue.
